
The Hidden Cost of Red Light Running in California — Full Research Report
Disclaimer: While this report will focus on facts and statistics, these stats represent real people whose lives have been lost or who have been seriously injured. Please don’t lose track of this.
Individual stories of lives impacted are also included and may contain graphic descriptions, which could be triggering for some.
Traffic collisions are, by and large, preventable. Multiple studies have established this, and it is also recognized by the NHTSA. The fact that we let so many people die year after year due to traffic violence, when we know how people get into traffic collisions, and where they are most likely to get into a traffic collision. We have proven ways to prevent it, which is a testimony to how broken our system is. Nowhere is this more evident than in intersections across California, where hundreds of lives are lost and even more are seriously injured. While a single life lost is tragic, and even more so when it’s entirely preventable, what’s hidden is the cost of these preventable deaths to our communities and the state of California.
Stories of Preventable Tragedies
A Professional Dancer Who Lost a Leg Due to Red Light Running
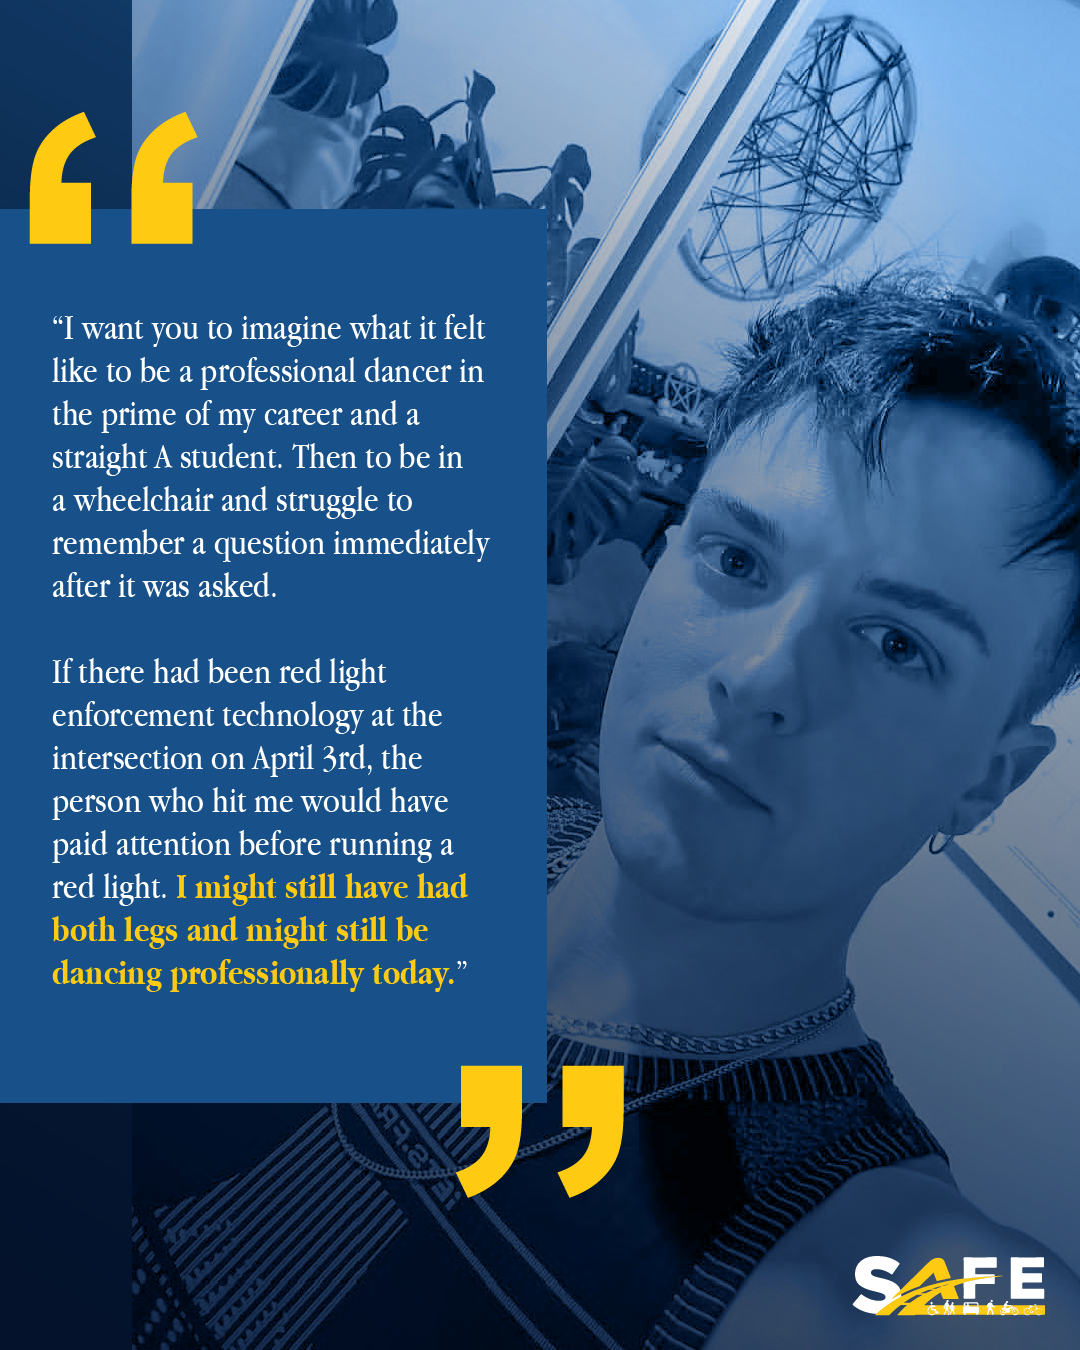
Ty Wells was a professional dancer in Los Angeles for over a decade, performing with global artists like Katy Perry, Shawn Mendes, and P!NK. On April 3, 2022, in Los Angeles County, his career and life trajectory were forever changed when an SUV driver ran a red light and struck him as he headed home from work.
The collision left Ty with a Diffuse Axonal Brain Injury, a coma that lasted six days, and ultimately the loss of his left leg below the knee. His right arm was paralyzed for months, and his memory so damaged he often couldn’t finish a conversation. For a 4.0 UCLA student and world-touring dancer, the devastation was immense.
Over time, Ty slowly regained movement in his hand and learned to walk with a prosthesis after a year, but the crash forced him to rebuild every part of his life. The same year Ty nearly lost his life, 69 people died, and 395 other people were severely injured just in Los Angeles County due to drivers ignoring red lights.
Source: Testimony from Ty Wells speaking on behalf of SB 720
FIRST SOME HISTORY
Traffic Signals: From Semaphores to Red, Yellow, and Green Lights
The first known traffic signal appeared in London in 1868, installed outside the Palace of Westminster, not the Houses of Parliament. It was a manually operated gas-lit signal with red and green arms, resembling a railway semaphore. Although innovative, it was short-lived—an explosion caused by the gas lamp severely injured the policeman operating it, and the device was removed.
Nonetheless, similar, albeit less hazardous, versions of the same manually operated semaphore traffic signals were installed more frequently throughout Europe and America as a means to manage the flow of carriages, horse riders, and those on bicycles.
With the mass production of automobiles in the early 20th century, the need for safer and more efficient traffic management became urgent. In 1912, Lester Wire, a police officer in Salt Lake City, Utah, designed one of the earliest electric traffic signals, featuring red and green lights mounted on a pole. By 1914, Cleveland, Ohio, had installed the first electric traffic light system with red and green signals and an audible buzzer to indicate changes.
A significant breakthrough came in 1920 when William Potts, a Detroit police officer, introduced the first three-color traffic light, adding the yellow light to warn drivers before the signal changed. This innovation quickly spread across the United States and beyond, forming the foundation of modern traffic control.
Traffic Signal Laws: From Common Law to Red Light Cameras
While signals could help manage traffic, their effectiveness depended on whether or not people followed them. While traffic collisions at intersections did not often result in fatalities when two horse-drawn carriages slowly collided with each other, as automobiles took over the roads and became more powerful, faster, and more numerous, collisions at intersections began to result in increasingly tragic consequences. As a result, laws and enforcement methods evolved.

1868 – The First Signal, No Laws Yet
The world’s first traffic signal was installed in London outside the Houses of Parliament in December 1868. It was gas-lit, manually operated, and resembled a railway semaphore. At this point, there were no traffic signal laws—compliance was enforced by police authority under general roadway rules.
Early 1900s – Local Ordinances in the U.S.
With the rise of automobiles, U.S. cities began experimenting with electric traffic signals. By the 1910s and 1920s, cities such as Cleveland (1914), Detroit (1920), and Los Angeles introduced traffic signals. The first stop sign was invented by Detroit police sergeant Harold “Harry” Jackson (1914). Local governments passed municipal ordinances requiring drivers to obey them, marking the first legal recognition of signal and sign control.
1920s – State Motor Vehicle Codes
By the mid-1920s, states began to codify traffic signal obedience into motor vehicle codes. This was a critical step, moving traffic lights from local experiments into statewide legal frameworks.
1927 – Precursor to MUTCD (United States)
In the U.S., efforts toward standardization produced early manuals for traffic control devices in 1927. These weren’t laws in themselves, but they became the foundation for enforceable regulations, ensuring that signals across jurisdictions followed the same meanings and designs.
1930 – Road Traffic Act (United Kingdom)
The UK’s Road Traffic Act of 1930 legally recognized automatic traffic lights for the first time, granting local authorities the power to install and enforce them. By 1933, London had hundreds of signals operating under this national framework.
1935 – The First MUTCD (United States)
The publication of the Manual on Uniform Traffic Control Devices (MUTCD) in 1935 standardized traffic signal design and placement nationwide. This made compliance with red, yellow, and green signals legally binding across the United States, replacing a patchwork of city ordinances with a national standard.
Mid–20th Century – Expansion & Pedestrian Rights
By the 1940s–1960s, most industrialized nations had established traffic laws that mandated obedience to traffic signals. Many also began to incorporate pedestrian signals and crosswalk rights. Laws expanded beyond vehicle control to cover pedestrian safety and right-of-way rules at signalized intersections.
1960s–1970s – Traffic Signal Automation
Technological improvements such as vehicle-actuated sensors and computerized timing systems were introduced, and traffic codes expanded accordingly. Laws began specifying the legality of amber light duration, signal preemption, and the integration of signals with larger urban traffic networks.
1980s–1990s – Red-Light Cameras Introduced
The next major legal shift came with the introduction of automated enforcement.
The first red-light camera system is often credited to the Netherlands in 1964 (using radar triggers), though it wasn’t widely adopted.
By the 1980s, modern photographic red-light enforcement had emerged in Australia, with Melbourne being a notable example (Melbourne, 1983).
In the United States, New York City pioneered the use of red-light cameras in 1992 through special state legislation. These required explicit laws authorizing photo enforcement since traditional statutes assumed a police officer would witness violations.
Stories of Preventable Tragedies
Neveah & Alinah, Two Sisters Who Never Saw Thanksgiving
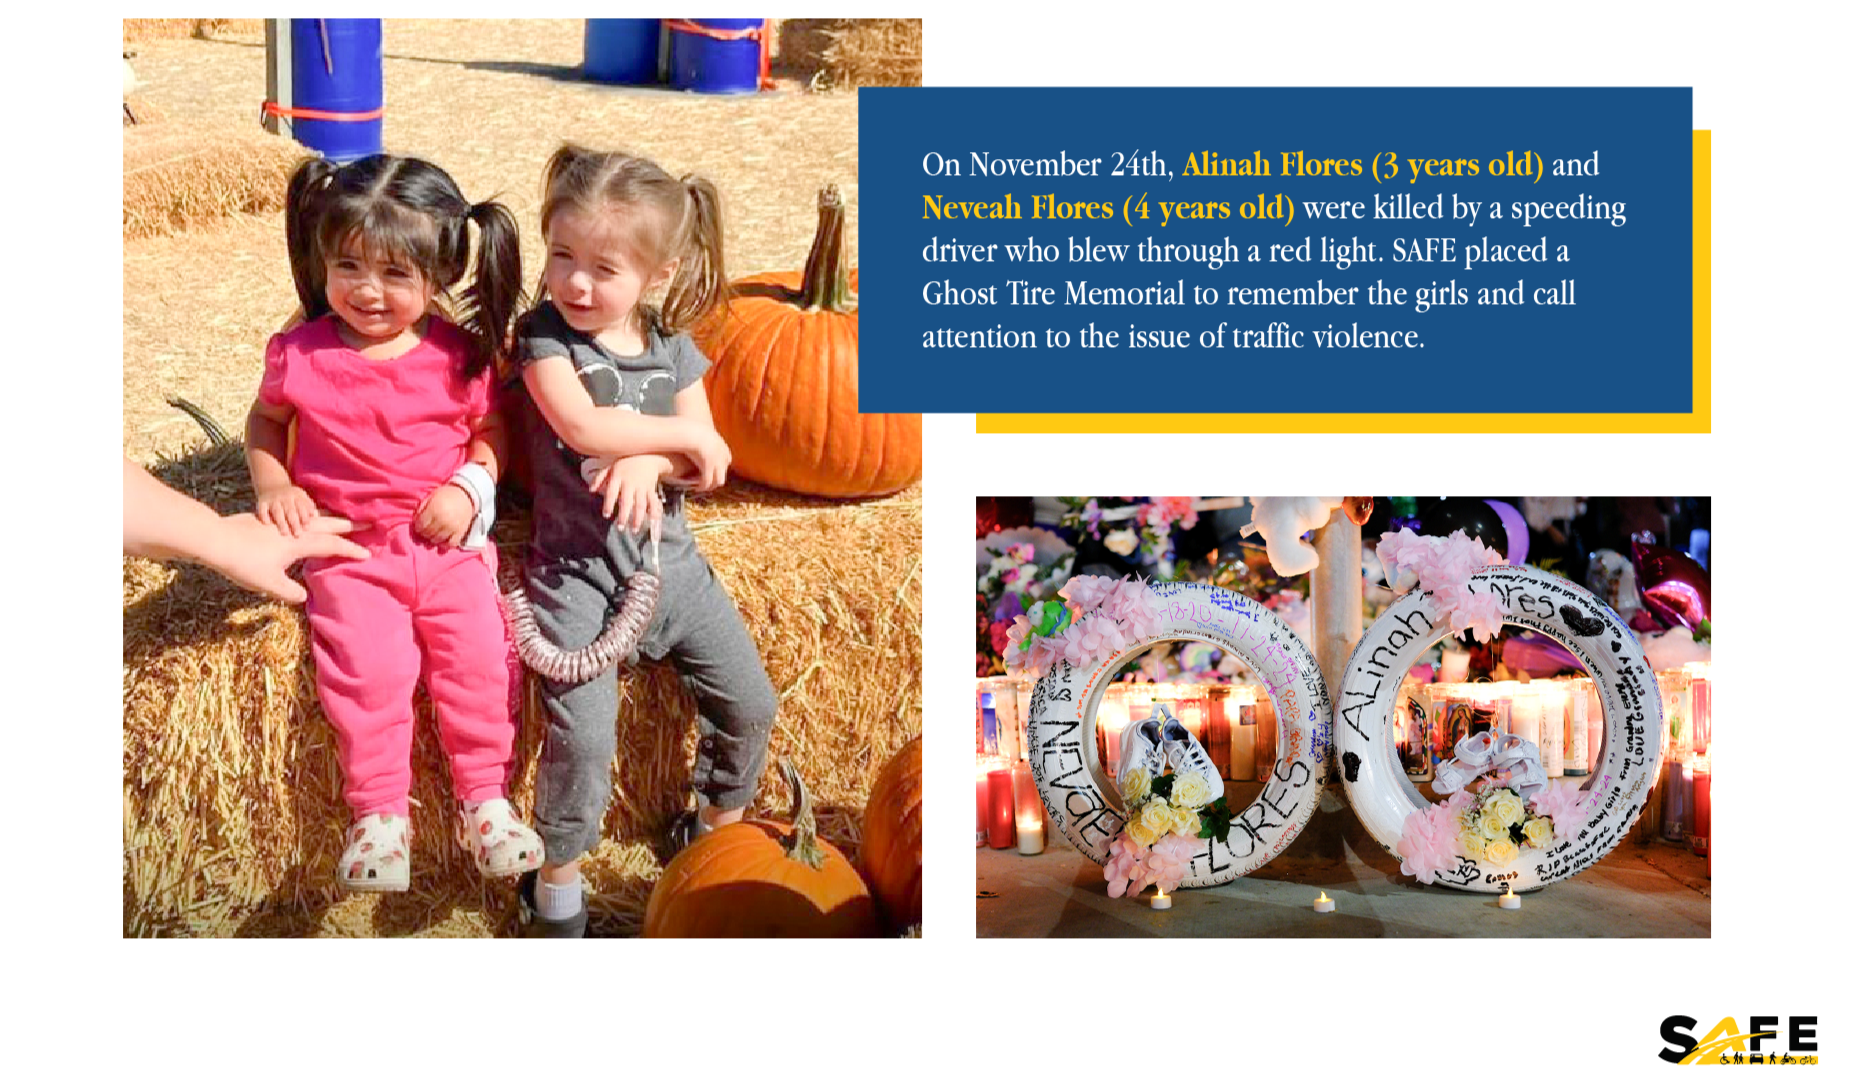
It was a quiet Sunday night, four days before Thanksgiving 2024, in Rialto, CA, when another family’s life was ripped apart in an instant. A mother and father were driving their two little girls—3-year-old Alinah and 4-year-old Neveah Flores— when they waited for the light to turn green. The mother pulled forward to make a simple left turn, but a speeding Dodge Ram blew through a red light. In a heartbeat, the pickup slammed into the family’s white Honda Accord with such force that it hurled the car into a tow truck nearby.
The impact was catastrophic. Both toddlers, secured in their car seats, suffered the brunt of the crash. One little girl was thrown from the vehicle. Despite desperate efforts, neither child survived.
Their mother and father were left injured but survived, forced to live with the horror of witnessing the unthinkable—the loss of their two children, gone in a flash, not because of fate but because someone chose to run a red light.
Neveah and Alinah were killed in San Bernardino County, where over the past three years, an average of 22 lives have been lost and 79 people have been seriously injured by drivers ignoring red lights.
HOW BAD IS RED LIGHT RUNNING IN CALIFORNIA?
With a Drop in Traffic Enforcement Came a Spike in Fatalities
Traffic lights are simple to understand – red means stop, yellow means prepare to stop, and green means go. A majority of drivers follow the law and obey traffic signals.
Until 2020, police forces spent part of their time enforcing traffic laws, including ticketing drivers who ran red lights. Some have complained that this was done just to make ticket quotas, and some have complained that all traffic enforcement was racially biased (there is hard evidence that some traffic enforcement, especially in specific areas, was racially biased). However, investigative reporting by the NY Times has found that traffic enforcement across the country, especially in larger cities like Los Angeles, has dropped drastically since 2020. At the same time, per data from the FARS Database maintained by NHTSA, fatalities across California have spiked. While the data for 2023 shows a modest drop in fatalities, the number of fatalities is still 9% higher than in 2019 (before COVID-19) and 30.7% higher than in 2013.

Intersection Violations Have Also Spiked Since 2013
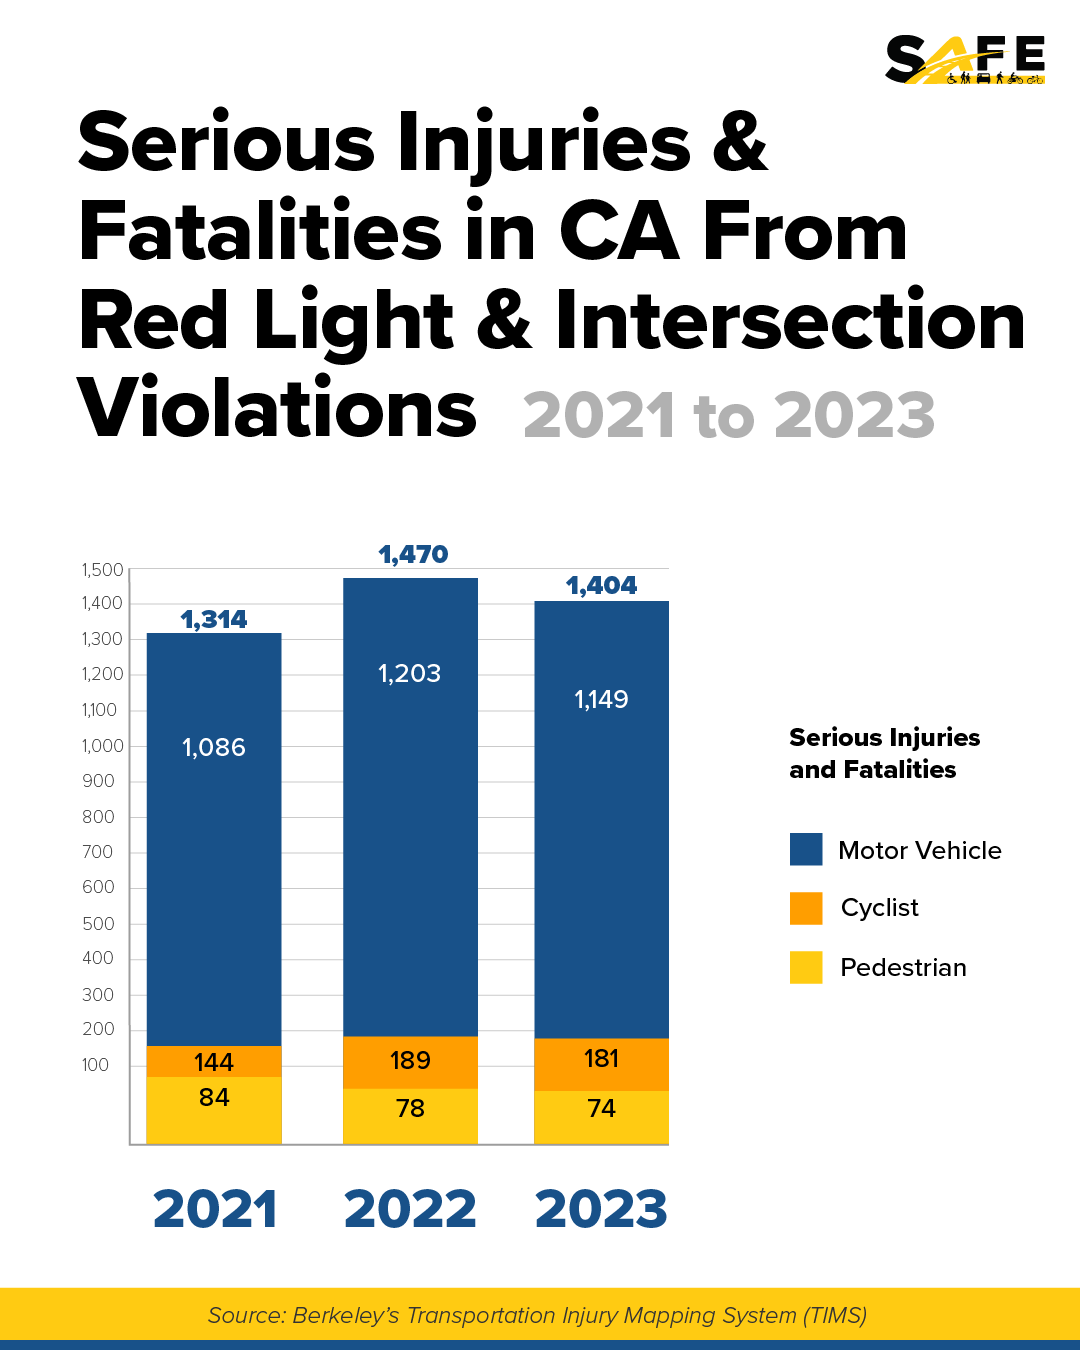
Using the UC Berkeley Transportation Injury Mapping System (TIMS), SAFE investigated the number of fatalities and serious injuries that have occurred since 2013. These figures represent both red light violations and stop sign violations. While the focus of this report is on red-light violations, four-way intersections where a high number of severe injuries and fatalities occur should be made safer by installing a traffic signal; therefore, the data for this report is presented together.
SAFE found that, not surprisingly, commensurate with an increase in traffic fatalities, there has been a drastic increase in fatalities and serious injuries due to intersection violations. In 2023 alone, red light violations were linked to 195 deaths and 1,209 severe injuries. While that's a slight decrease from 2022, which saw 259 deaths and 1,211 serious injuries, the numbers are still very concerning. Since 2013, there’s been a staggering 96.1% increase in serious injuries and fatalities due to intersection violations.


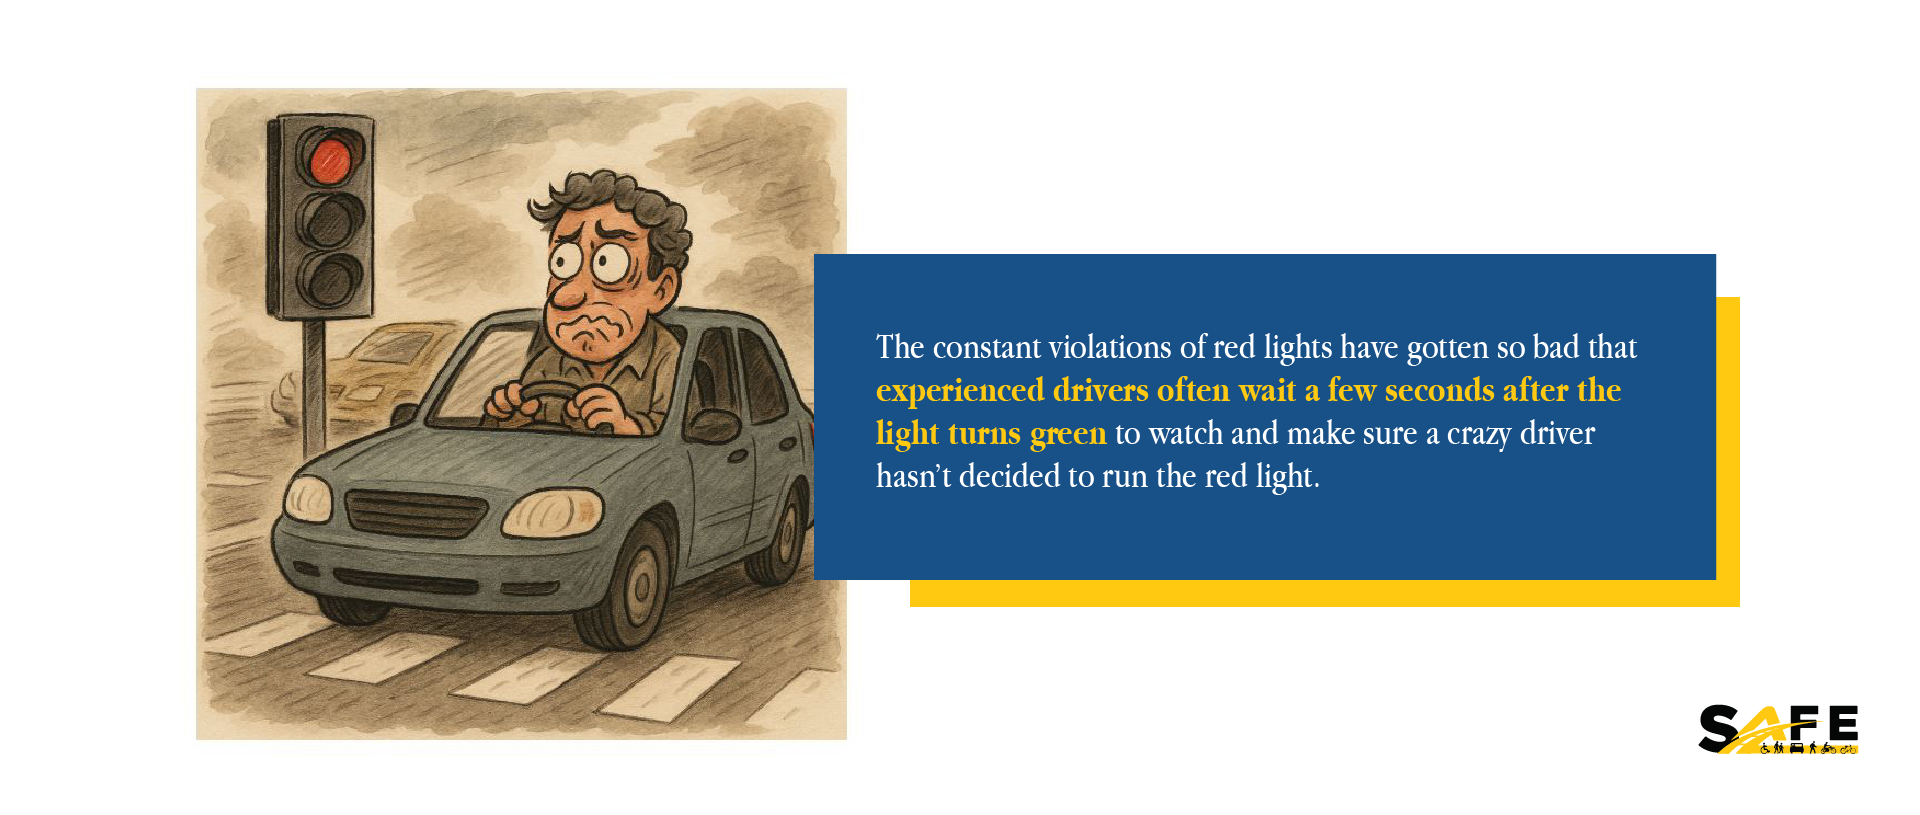
In cities, the constant violations of red lights have become so severe that experienced drivers often wait a few seconds after the light turns green to watch and ensure a reckless driver hasn’t decided to run the red light.
These red light and intersection violations are killing hundreds and severely injuring thousands each year, but it’s not just drivers who are being hit and killed. Analysis of data provided by TIMS shows that in 2023, 18.16% of those seriously injured or killed were pedestrians or cyclists. These figures make one thing clear: California is facing a worsening crisis on its roads, especially at intersections, and something needs to change.
Intersection Violations by County
SAFE then examined intersection violations for each county between 2021 and 2023 and compared the number of severe injuries and fatalities at intersections by number and on a per capita basis (per 100,000 people), and this is what was found:
Los Angeles County, representing 25.1% of California’s population, has 31.1% (an average of 420 per year) of the severe injuries and fatalities due to intersection violations. This is the largest amount compared to other counties, but not the largest per capita.
The average number of severe injuries and fatalities for the entire state of California is 3.56 per 100,000 people..
Inyo County, with a population of less than 19,000, averages only two people severely injured or killed per year due to intersection violations, but is ranked as the most dangerous per capita, with 10.78 per 100,000.

When looking at only the largest counties in California by population (those with populations larger than 750,000), the five most dangerous counties per capita are (in this order):
Fresno County (6.86)
San Francisco County (5.09)
Kern County (4.94)
Sacramento County (4.66)
San Bernardino County (4.57)
Los Angeles County (4.26)

SAFE also found that, in more rural counties, a higher proportion (sometimes all) of severe injuries and fatalities happened at four-way stop intersections, often on a stretch of rural road with little to no improvements made to slow down speeding cars. In contrast, in counties with larger populations, a majority of the incidents occurred at signaled intersections where cars would run red lights.
The Hidden Cost of Red Light Running in California

While the lives lost and those severely injured can be more easily measured, what tends to be overlooked is the enormous cost that these violations have on the State of California. SAFE was able to use the CDC’s Web-based Injury Statistics Query and Reporting System (WISQARS) Cost of Injury calculator to figure out the economic impact of this issue. SAFE looked at:
Fatalities
The average medical costs, including the cost of medical transportation in California
The Average “Value of Statistical Life” Per Fatality in California. The Value of Statistical Life calculates a monetary estimate of the value of mortality risk reduction, as derived from research studies.
Severe Injuries
The average lifetime medical costs (both in the hospital and afterwards), including the cost of medical transportation in the United States.
The average “Work Loss Cost” for a nonfatal traffic collision in the United States. Work Loss Cost refers to the average amount of lost income due to being unable to work.
The average “Quality of Life Loss Cost” for a Nonfatal Traffic Collision in the United States. Quality of Life Loss Cost calculates the monetary burden that a disease or injury imposes on an individual, their family, and the community.
Based on this data, SAFE calculated that between 2021 and 2023, red light and intersection violations resulting in severe injuries alone cost the state approximately $985 million, averaging $327.3 million per year, with 28% of that ($270.4 million) attributed to medical costs alone.
Between 2021 and 2023, red light and intersection violations resulting in fatalities cost California an estimated $6.96 billion, averaging $2.32 billion per year.
Stories of Preventable Tragedies
They Just Graduated High School but Will Never Go to College

On 2 May 2025, at the intersection of Clovis and Shields in Fresno, a driver in a Land Rover barreled south on Clovis Avenue, ignoring the red light. At that exact moment, a Ford Focus lawfully entered the intersection on a green. The impact was devastating. The Ford spun violently, slammed into a fence, and burst into flames.
Inside were three young lives at the beginning of their journey. Good Samaritans rushed into the fire, managing to pull one passenger to safety. But for 18-year-old Maddux Greene and 19-year-old Jordan Galvez—both recent graduates of Clovis East High School—the crash was fatal. Greene died at the scene. Galvez succumbed to his injuries the next morning.
This wasn’t an “accident.” It was preventable. Every time a driver decides to run one, they gamble not just with their own future, but with the lives of everyone around them. On this night, that gamble claimed Maddux and Jordan.
With an average of 6.86 fatalities or serious injuries per capita, Fresno County is the deadliest large county (compared to those with more than 750,000 residents) in California for red light and intersection violations.
Source: Fresno Bee, ABC 30, UC Berkeley’s Transportation Injury Mapping System (TIMS)
SOLUTIONS
Strategies to Reduce Intersection Violations
There are three broad strategies to reduce intersection violations – enforcement, education, and engineering – but as human behavior is not always predictable, the degree of effectiveness of these individual strategies is also not always predictable, and to really save lives, the best practice is to use these in combination:
Engineering reduces the opportunity for violations.
Enforcement ensures accountability when violations occur.
Education fosters a culture where drivers prioritize safety above all else.

Here’s how each solution works:
Enforcement
Enforcement makes the consequences of running red lights visible and immediate, deterring risky behavior. Common strategies include:
Red Light Cameras: Automated cameras capture only license plates of violators, ensuring consistent enforcement even when officers aren’t present.
California currently allows red light cameras under an archaic legal framework. This poorly written code is rarely used as an enforcement and educational tool. This is covered more in depth below.
Increased Police Patrols: Focused traffic units stationed at high-risk intersections provide visible deterrence.
As discussed above, with police forces struggling to maintain staff levels and priorities shifting away from traffic enforcement, this has been done less frequently since 2020.
Graduated Penalties: Escalating fines, points on licenses, or mandatory driver courses for repeat offenders.
This could work if any enforcement is actually being done.
Data-Driven Enforcement: Using crash and violation data to target the most dangerous intersections rather than random patrols or red light cameras at random intersections.
Education
Education raises awareness about the dangers of red-light running and alters social norms surrounding intersection safety.
Driver Training Programs: Emphasizing intersection safety in driver’s ed, defensive driving courses, and fleet training.
Although not the worst among US states, California's driver’s education requirements are more lenient compared to those of other developed countries, which tend to be statistically safer. For example, in England, which is four times safer than the United States, new drivers typically undergo 3-6 months of intensive theory and practical training before taking their written and practical tests. This includes 50% more theory training and twice the amount of practical training under the guidance of an instructor. Typically, new drivers must retake their tests several times, returning each time to review their theory and practical training before passing.
School & Youth Outreach: Early education to shape long-term safe driving behaviors.
Community Engagement: Involving neighborhood groups, victims’ families, or safety advocates in spreading the message (personal stories are powerful).
This can make a significant difference if it is done extensively over an extended period, but it rarely is.
Public Awareness Campaigns: PSAs, billboards, and social media campaigns featuring real-life consequences (crashes, injuries, fatalities). This messaging often works best when it appeals to self-interest (e.g., “Running a red light won’t save you time, but could cost you your life”).
These campaigns have had mixed results, mainly depending on the extent to which they are implemented. A few billboards in a large community for a few months are unlikely to have a significant impact on the safety of intersections.
Engineering
Engineering changes the roadway environment to make intersection violations less likely and reduce the severity of crashes. Some of these solutions are inexpensive and easy to implement, while others require larger investments of funds that many cities may not have readily available.
Signal Timing Adjustments:
Extended Yellow Intervals to give drivers more decision time.
All-Red Clearance Intervals (brief all-red phase) to clear intersections before cross traffic moves.
Improved Signal Visibility: Larger signal heads, overhead placement, and backplates with reflective borders.
Advance Warning Lights: Flashing lights that warn drivers that a signal is about to turn red or that a stop sign is ahead.
Intersection Redesign:
Better signage and markings (“Signal Ahead” warnings, pavement arrows).
Roundabouts (reduce angle crashes common in red-light running).
Protected turn lanes with dedicated signals to avoid confusion.
Roadway Environment Changes: Speed humps, raised crosswalks, and narrowing lanes near intersections to slow vehicles approaching the intersection.
Can We Solve Red Light Violations With Engineering Alone?
As discussed above, there is a notable decrease in traffic enforcement, as police are not consistently enforcing the laws, and red light cameras are rarely utilized in California. California’s driver training program is considered lax compared to other states, and current education and awareness campaigns are often minimal or ineffective. That just leaves engineering solutions as a way to reduce red light violations.
Can we solve red light violations with engineering solutions alone? Assuming the money magically appeared to improve every dangerous intersection, no engineering solution has been created that can prevent a driver from running a red light and causing a severe or fatal collision. Speed humps and raised crosswalks can help slow a vehicle from entering an intersection at high speeds. This works best at four-way stops, but they are recommended against on high-speed, high-capacity roads called arterials. Speed humps and raised crosswalks are also sometimes recommended against by local fire departments, as they believe the benefits of a slower, safer road don’t outweigh the drawbacks of potentially slower emergency response times.
However, more fundamental to the question of whether any engineering solutions can prevent intersection violations is the issue of funding. There are so many intersections that are known to be dangerous (have a high incidence of severe or fatal crashes) that the cost of re-engineering every dangerous intersection is prohibitively expensive.
For example, in the City of Los Angeles alone, an LA DOT report identified 90 intersections as being the most dangerous. The cost to improve the safety of these intersections can vary widely, ranging from $5,000 to more than $5,000,000. Below is a model “cost by level of intervention” table based on California / U.S. references, showing rough cost ranges for different scales of intersection safety upgrades. These are illustrative—not guarantees—and actual costs depend heavily on site conditions, right‐of‐way, utilities, and design complexity.
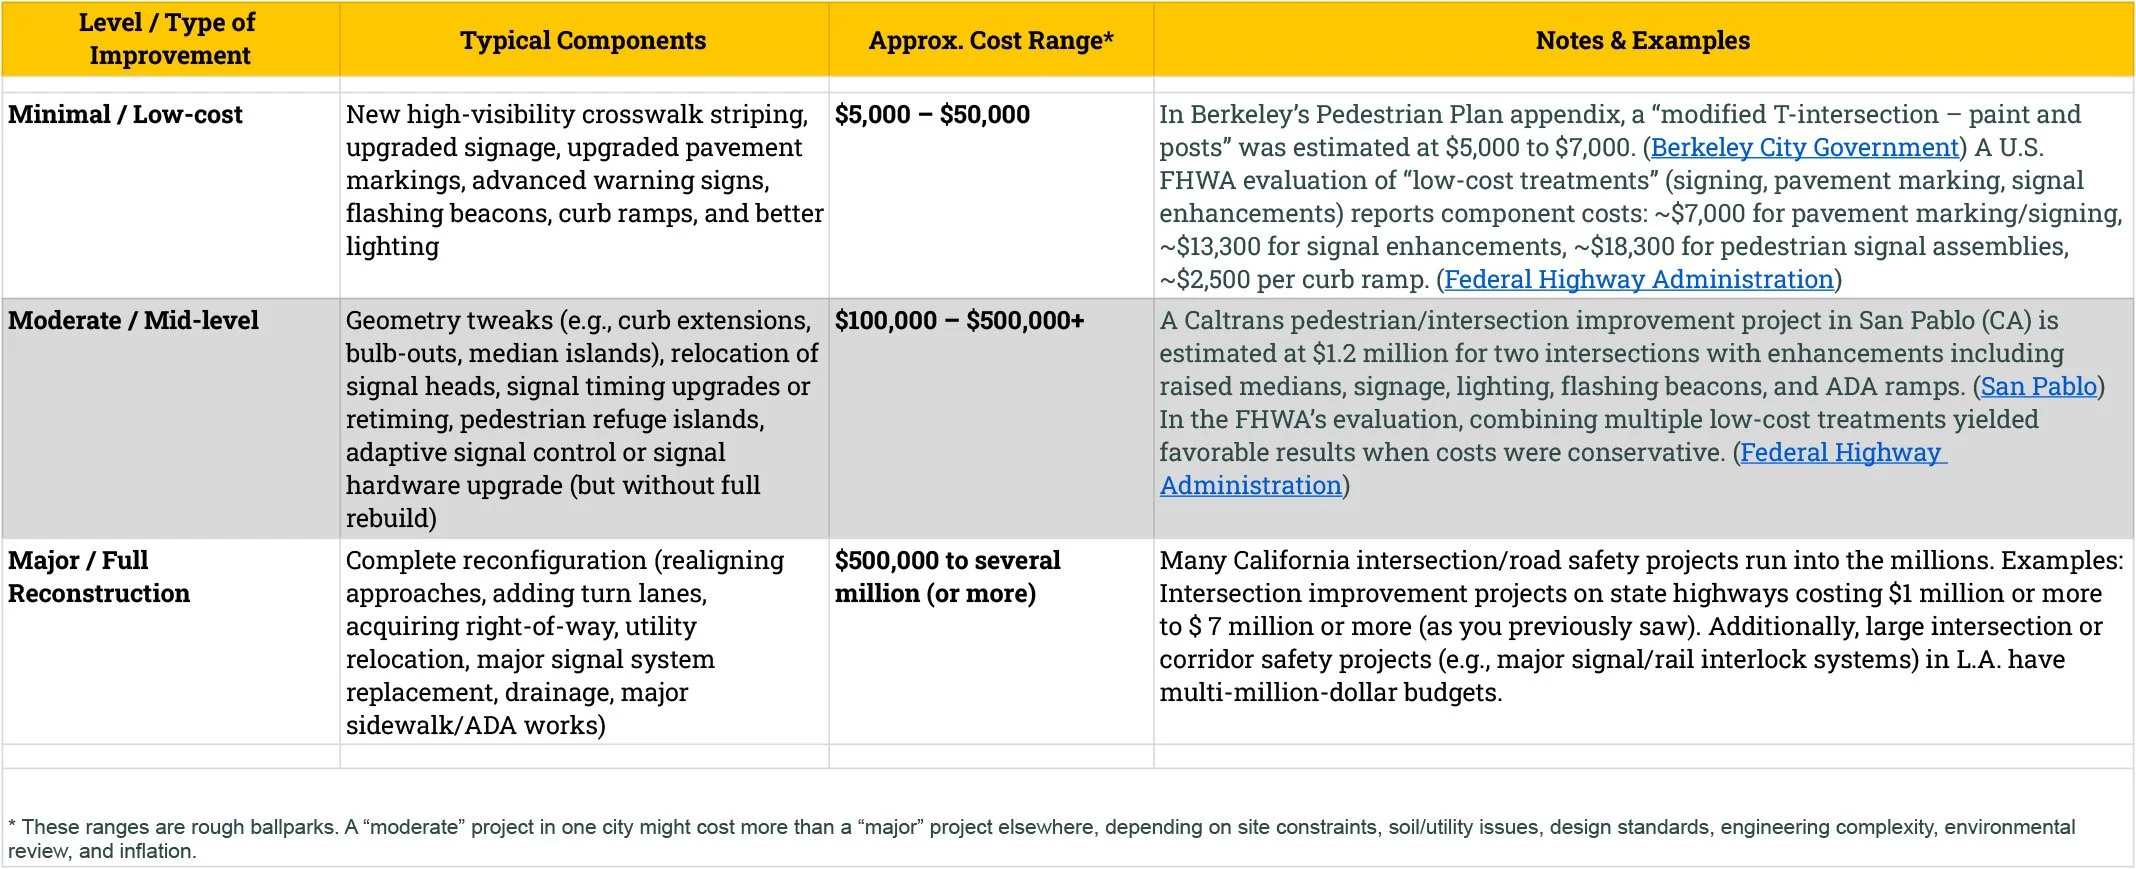
If the average cost to properly re-engineer an intersection is $400,000, then the cost to improve all 90 intersections would top 36 million, which is more than LA DOT spent on all road safety improvements in Los Angeles for 2023.
Therefore, the answer to the question of whether engineering solutions alone can prevent intersection violations is clearly no. Preventing intersection violations still requires enforcement solutions and should be complemented by comprehensive education and awareness campaigns to address the issue entirely.
Stories of Preventable Tragedies
Three Teenagers Seriously Injured, One Didn’t Make It.
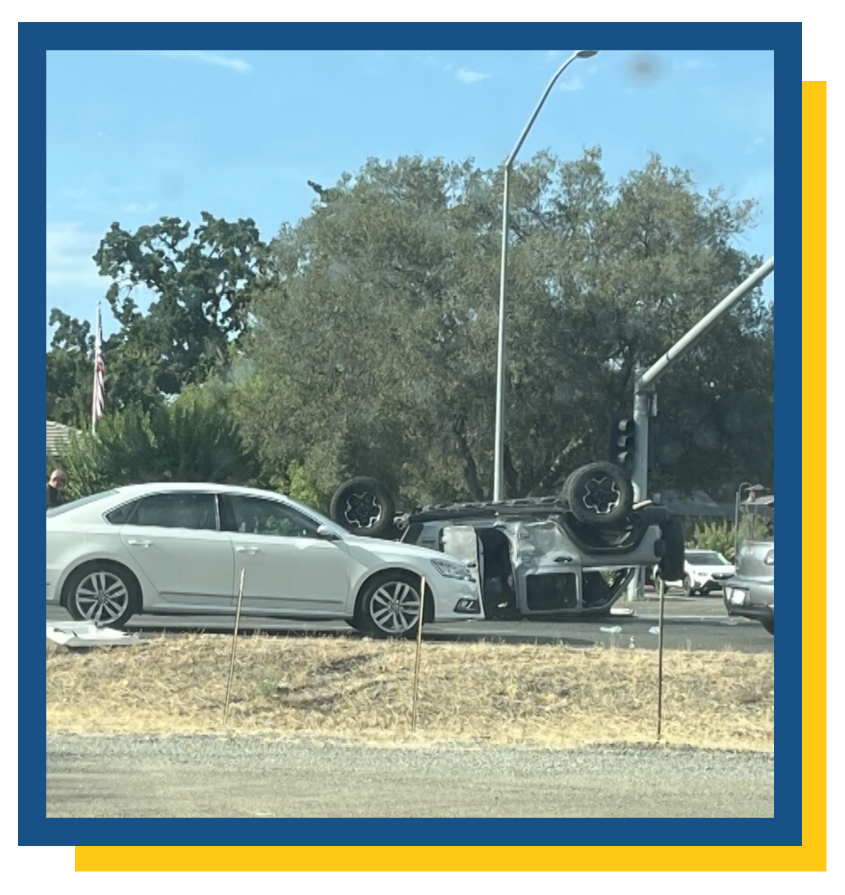
On a Sunday evening, 16 July 2023, in Granite Bay, a community in Placer County, CA, a Jeep carrying three teenagers approached the intersection of Douglas Boulevard and Barton Road just after 5:30 p.m. According to the California Highway Patrol (CHP), the Jeep ran a red light—and in that moment, fate collided with recklessness. (CBS News)
An SUV struck the Jeep forcefully, broadsiding it and flipping the vehicle. The impact was so violent that the rear-seat passenger—a 15-year-old girl—was partially ejected. (CBS News)
In the chaos, all three teens were rushed to a hospital. Unfortunately, the 15-year-old succumbed to her injuries. The other two teens sustained non-fatal injuries. (CBS News)
That night, what began as a ride with friends ended in irreversible tragedy.
CURRENT EFFORTS TO SAVE LIVES
While engineering solutions are hindered by a lack of funds, and police enforcement has been reduced to below minimum levels, red light cameras are effectively used in many other states to reduce intersection crashes, severe injuries, and fatalities. The stats speak for themselves.
According to the National Institutes of Health, the installation of red light safety cameras in large cities resulted in a 21% reduction in fatal red light violations and a 14% decrease in other types of fatal crashes at signalized intersections.
An evaluation of the use of red light cameras across 9 locations in Fairfax, VA, found a 40% reduction in red light violations one year after the systems were installed.
Researchers from the Insurance Institute for Highway Safety reviewed 79 cities with red light camera programs and estimated that these programs saved nearly 1,300 lives in a single year.
The same report found that shutting down such programs costs lives, with the rate of fatal red-light-running crashes shooting up 16% and red light running crashes of all types increased by 30%.
California’s Red Light Camera System: Outdated, Inefficient, and Failing
Although red light running and speeding remain severe and persistent problems on California roads, the state’s red light camera law hasn’t had a significant update since it was first introduced in 1995. The system is outdated and plagued with issues, prompting many cities across the state to shut down their red light camera programs altogether.
The biggest problem with California's current red light camera law is that it requires a clear photo of the driver's face to issue a citation. This may have made sense in 1995, but it's created a mess. Cities spend thousands on camera systems, only to have most tickets thrown out because the footage is not clear enough to identify the driver. It's expensive, ineffective, and an invasion of privacy to have cameras trying to photograph people's faces.
Furthermore, the financial burden is substantial. Fines can reach up to $500 per violation, and because these violations are considered moving violations, these citations can affect both a driver’s record and insurance rates, but only if they aren’t dismissed in court. As a result, many cities are unable to cover the basic operating costs due to the number of unpaid violations, making the current red light camera program both inefficient and ineffective.
Revision and Revamp are Needed
Severe injuries and fatalities due to red light and intersection violations have almost doubled since 2013. Yet, due to the lack of revisions to California's current automated red light camera enforcement system, it has led to thousands of preventable serious injuries and fatalities and cost the state billions of dollars. California’s red light camera system needs to be revised to save lives, and this is where SB 720, the Safer Streets Program, comes in.
SB 720 is modeled after AB 645 – Speed Safety Systems (another bill SAFE helped pass), which is considered the gold standard across the US for implementing automated enforcement correctly. SB 720 is designed to address privacy concerns by prohibiting systems from taking photos of the driver’s face while also enhancing enforcement. Instead of trying to identify the driver, it works like a parking ticket; the citation goes to the car's owner. The camera captures the license plate and the violation, nothing more. No facial recognition, no privacy invasion, just straightforward enforcement.
The bill also addresses the financial issue. Currently, cities often use revenue from red light cameras to supplement their general budgets, which gives the whole thing a misleading appearance of a cash grab. Under SB 720, that revenue must be reinvested in traffic safety, including improved signals, pedestrian enhancements, and other intersection safety measures.
SB 720 doesn’t replace traditional police enforcement, and it certainly doesn’t replace education. It would increase the number of basic strategies that can be used, from a few engineering tools to engineering and enforcement, and it would help to provide funds to implement other, more expensive, engineering tools in more intersections. This can only help to save lives. How many lives depend on how many of the most dangerous intersections would use this technology after SB 720 is passed?
SB 720 is currently under consideration at the Governor’s office. It represents a critical opportunity to revamp California’s red light camera program in a way that prioritizes public safety and looks to save lives. It's a step California urgently needs to take.
So, the final question is: will the Governor of California continue to allow lives to be lost when an easy solution is waiting for his approval?